Sentiment analysis part 1
by
ted
My goal for this project is to analyze how people in data science feel about their jobs. More specifically I will will gather data from the r/datascience subreddit and figure out what the talk is there.
The code notebook without annotations can be viewed here
Step 1 (connect to our data source)
- create reddit developer account to access reddit API
- install the PRAW lib for python
- test to see if we are connected
# Connecting our credentials

import praw

reddit = praw.Reddit(

client_id = "myid",
client_secret = "mysecret",
user_agent = "myuser"
)

# Test by printing top 4 titles on r/datascience

subreddit = reddit.subreddit("datascience")

for post in subreddit.hot(limit=4):

    print(post.title)
- We are testing to see if our reddit credentials have been successfully connected
- doing a proof of concept by printing out the top 4 posts in the r/datascience subreddit
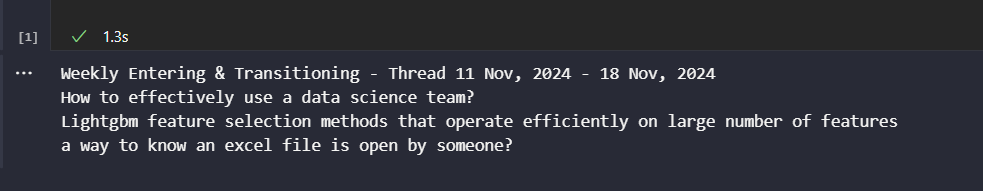 Success!
Step 2 (preprocess our data)
Our goal here is to prepare the reddit posts for our eventual sentiment analysis. We cannot jump right in as we will have some problems in the formatting such as URLS, special characters, emojis and so on. We might also want to lowercase all the text though that might affect the sentiment analysis. For example don’t and DON’T convey two different tones of sentiment.
Let’s however try and get a bit more data from our reddit posts first.
# Getting the posts from r/datascience

subreddit = reddit.subreddit("datascience")

# Getting the top 4 hot posts with number of comments, upvotes and the text

posts = []

for post in subreddit.hot(limit=4):
    posts.append({

        "title": post.title,
        "text": post.selftext,
        "score": post.score,
        "comments": post.num_comments
    })

print(posts)
- doing another proof of concept by printing the hot 4 reddit posts with the title, the body of the post, the upvotes and the number of comments
Ok now let us try and fetch the actual comments.
# fetching the comments in the 4 hot posts

comments = []

for post in subreddit.hot(limit=4):

    post.comments.replace_more(limit=0)

    for comment in post.comments.list():

        comments.append({
            "post_title": post.title,
            "comment_text": comment.body,
            "comment_score": comment.score
       })

print(comments)
- there is one very important line of code here in
post.comments.replace_more(limit=0) - to understand what this does let’s look at a reddit post with a lot of activity

- The + button highlighted in red is a “more comments loader” which serves the purpose of keeping the post looking less cluttered and less resource intensive. Think of how hard to read the comments would be if for the top comment there were 50 replies. Just to get to the 2nd comment on the post you would have to do a lot of scrolling. Additionally think of the strain on the website if every time you clicked on a post, reddit had to load every single comment.
- Now that we know the functionality we have to note that it hinders our comment fetching process. We want to get rid of this functionality so that we can fetch every comment in the post. That is where
post.comments.replace_more(limit=0)comes into play. We simply set the number of + signs or “more comments loaders” to 0.
Cleaning the text data
We are getting to the first big obstacle of this whole project which is cleaning and organizing our data. As said before we are going to have to remove a lot of unnecessary jargon such as URLS, emojis, and symbols. Two python libraries that can help with this are RegEx and nltk. Before using these in code let’s try and see why and how we can use these libraries.
Benefits of nltk
- Stopword removal —> removes words such as, “and”, “the”, “is” which don’t add value to us.
- e.g. “The fox is brown and fast” —> “fox brown fast”
- Tokenization —> splits sentences into a list of words for easier processing.
- e.g. “fox brown fast” —> [“fox”, “brown”, “fast”].
- Stemming —> reduces words to their base form for easier processing.
- e.g. “jumping” —> “jump”
Benefits of RegEx
- Removes URLS –> “check this out https://google.com” —> “check this out”
- Removes special characters –> “data science is awesome🔥🔥🔥!” –> “data science is awesome”
- Removes spaces –> “what is a linear /n regression “ –> “what is a linear regression”
By removing the noise with nltk and RegEx our model will be able to focus on the essential words that carry the sentiment, allowing our results to be more accurate and interpretable.
Ok let’s get into the actual code.
import re
import nltk
from nltk.corpus import stopwords

nltk.download("stopwords")

stop_words = set(stopwords.words("english"))
- downloading the latest stopword wordlist to reference
stop_words = set(stopwords.words("english"))turns the list of stopwords into a set which is faster when checking to see if our text has these stopwords in them
# Cleaning our text

def clean_text(text):

    # Remove special characters
    text = re.sub(r"[^a-zA-Z\s]", "", text)

    # Remove URLS
    text = re.sub(r"http\S+|www\S+|https\S+", "", text, flags=re.MULTILINE)

    # Convert to lowercase
    text = text.lower()

    # Remove stopwords
    text = " ".join([
        word for word in text.split() if word not in stop_words
    ])

    return text
- removing the URLS, special characters and stopwords
# Cleaning posts and comments
cleaned_posts = [{

    "title": clean_text(post["title"]), "text": clean_text(post["text"])

    } for post in posts]

cleaned_comments = [{

	"post_title": clean_text(comment["post_title"]), "comment_text": clean_text(comment["comment_text"])

    } for comment in comments]
- constructing the cleaned versions of the posts and comments as previously mentioned
- creating a dictionary in
cleaned_postsandcleaned_comments
Step 3 (framing our data)
We will use pandas which is a data manipulation library, more specifically we will put to use DataFrame which will allow us to format our data like an excel spreadsheet. We should also import numpy which will help us in storing the data.
import numpy as np
import pandas as pd

# Convert posts to DataFrame
posts_df = pd.DataFrame(cleaned_posts)

# Convert comments to DataFrame
comments_df = pd.DataFrame(cleaned_comments)

# Proof of concept
print(posts_df.head())
- converting the posts and comments into a pandas
DataFrame
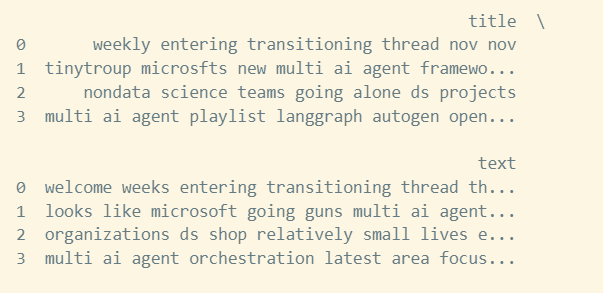
- hmmm not the best output, let’s try to clean up a bit more
The “job” problem
To progress we need to get rid of the posts that don’t pertain to what we are trying to figure out, which is the sentiment on jobs in data science. How should we go about this? The method shouldn’t be too hard, we just remove the posts that don’t have the word “job” in them. But what about the words “internship”, “salary”, “work”, “workplace” and more that I can’t think of right now? What exactly is our criteria for this elimination?
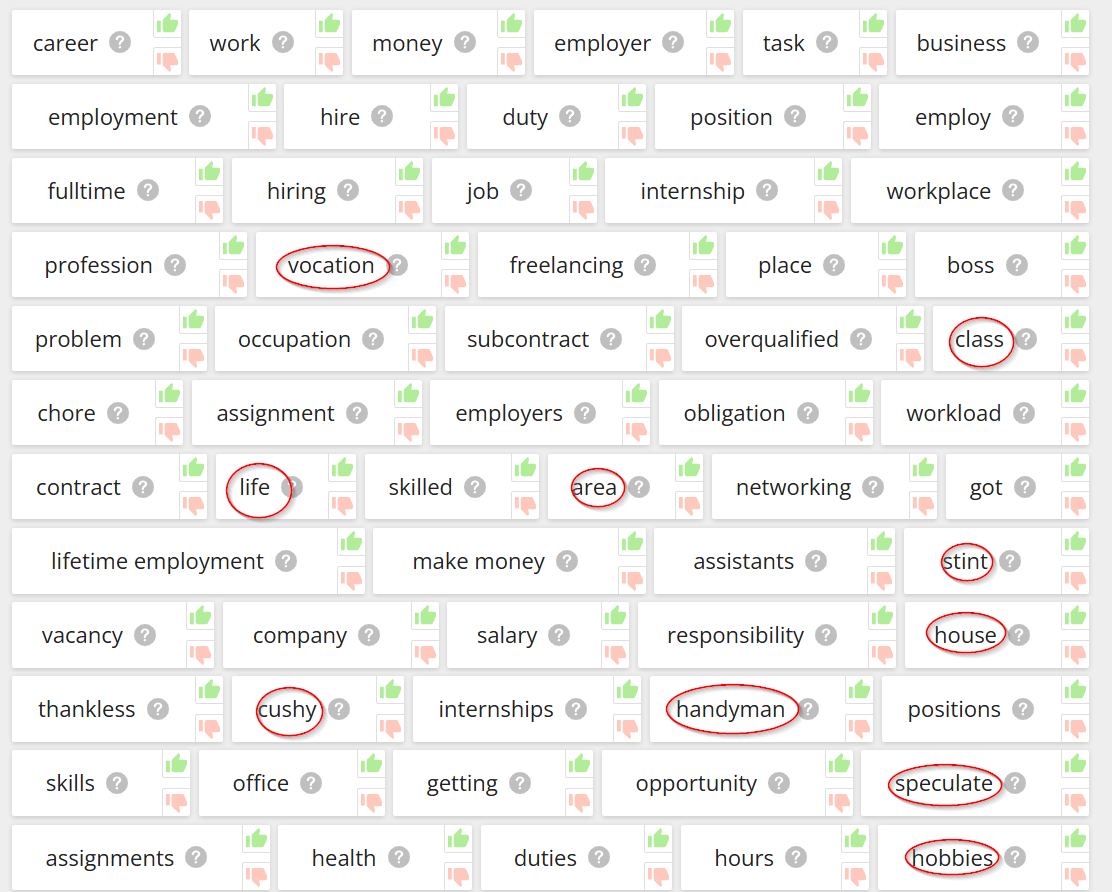
- a lot of these words have nothing to do with what we want to analyze
- let’s take a small subset of these
- Should the words be handpicked or through an algorithm?
- How many words should be in the subset?
In regards to handpicked vs. algorithm, the time it takes to handpick a wordlist will be less than designing an algorithm to pick the words. The accuracy difference should also be very minimal making it not worth the time or effort. For the subset let’s take 10-15 words.
# Filtering posts not related to our analysis
filtered_posts_df = posts_df[posts_df["title"].str.contains("job|salary|intern|work|career|pay|position|skill|profession|employ|hire|company|money|", case = False, na = False)]
- we filter out the posts that don’t have the keywords in them
- The key words chose were job, salary, intern, work, career, pay, position, skill, profession, employ, hire, company, money
- note that each word covers each of its substrings, since we include “work” in the wordlist –> “workplace”, “worker”, etc. are all included in the string as well
Further data framing
# merging filtered posts and comments
merged_df = pd.merge(
    filtered_posts_df,
    comments_df,
    right_on = "post_title", # match on title in post
    left_on = "title",       # match on post_title in comments
    how = "inner"            # keeping rows that match

)
merged_df.head()
- here we are merging the comments and their respective posts in tabular form
- “
post_title” and “title” are the same thing but we get an error when only including one of them
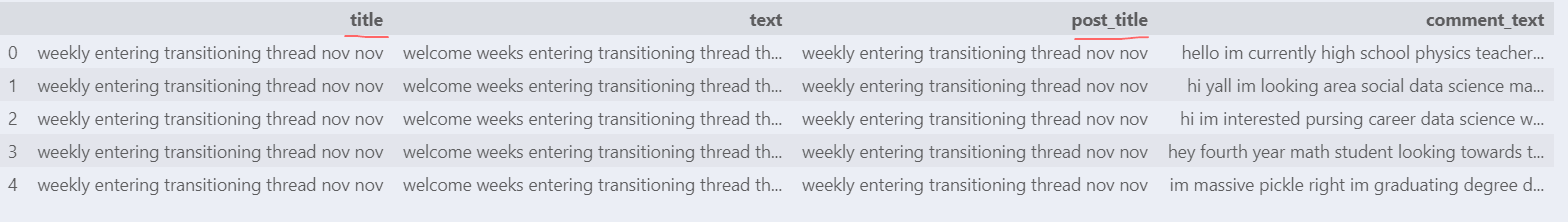
- we can get rid of
posts_title
# remove posts_title column
merged_df = merged_df.drop(columns = ["post_title"])

merged_df.head()
- perfect
Let’s check the general health of our dataset.
# Check for missing values
merged_df.isnull().sum()
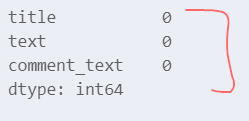
- perfect, no missing values in any of the rows
# Check the number of rows and columns
merged_df.shape

Out[17] = (73,3)
- check the shape of the data frame
- small problem…. why is the output (73,3)?
- 3 columns is fine but why is there only 73 rows? there should be way more comments
Upon enumerating the dataset I found out we only have 4 different posts worth of data. Why this is the case… I’m not sure. One theory I can come up with is in the process of cleaning the data we removed….WAIT
Remember way back when we first connected to to our data source? Let’s bring that code back up.
# Connecting our credentials

import praw

reddit = praw.Reddit(

client_id = "myid",
client_secret = "mysecret",
user_agent = "myuser"
)

# Test by printing top 4 titles on r/datascience

subreddit = reddit.subreddit("datascience")

for post in subreddit.hot(limit=4):  # The mistake is here

    print(post.title)
- when we set the limit of posts to 4 this wasn’t just a test to see if it worked, we also committed to fetching only the top 4 posts and nothing more!
- Let’s set the limit to 100 to fix this
- (note everywhere we set the limit to 4 we will have to change)
# Check the number of rows and columns
merged_df.shape

Out[38] = (3616,3)
- much better
Now we should also add the comment upvotes to our data frame
# Add the upvotes of each comment
merged_df["comment_score"] = [comment["comment_score"] for comment in comments]

ValueError: Length of values (3256) does not match length of index (3616)
- ok we are getting an error, looks like we have more comments than upvotes
- Let’s get some more info on our data set
merged_df.describe()
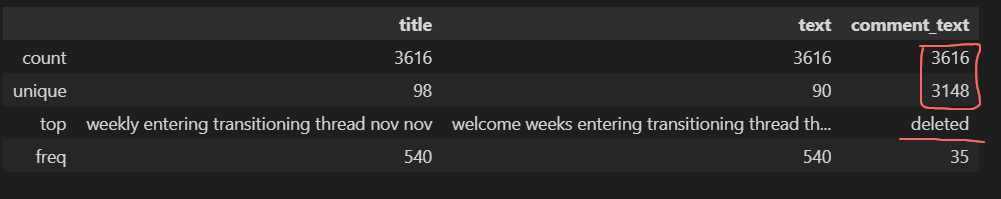 Some interesting information here, our dataset seems to be retaining deleted comments and we also seem to have quite a few duplicate comments. The relation to the upvotes problem is not clear but let’s fix the duplication problem at least.
# Get rid of rows with "deleted" in the comment_text column
merged_df = merged_df[merged_df.comment_text != "deleted"]

merged_df.describe()
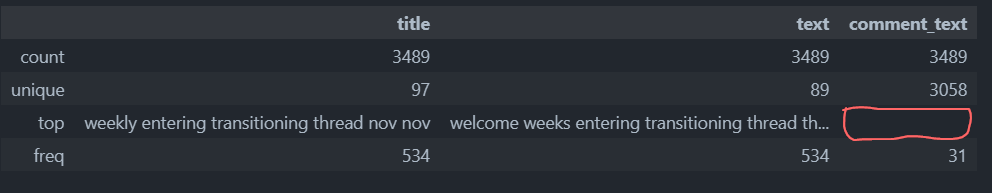
- the empty entry here is fine since it just means we do not have a most common value in
comment_text
Fixing the upvotes problem
Before we go about deleting rows and rows of information let’s try and add the upvotes column. The upvotes column is important since it adds more weight to the sentiment of a particular comment. For example a comment that says “machine learning is awesome” with 20 upvotes should have more weight than a comment that says “machine learning sucks” with 5 upvotes.
Unfortunately this statistic was forgotten somewhere in the code so we need to go back and add it in,
# Cleaning posts and comments
cleaned_posts = [{

    "title": clean_text(post["title"]), "text": clean_text(post["text"])

    } for post in posts]

cleaned_comments = [{

	"post_title": clean_text(comment["post_title"]), "comment_text": clean_text(comment["comment_text"])

    } for comment in comments]
- here is our culprit
# Adding upvotes to dictionary
cleaned_comments = [{

	"post_title": clean_text(comment["post_title"]), "comment_text": clean_text(comment["comment_text"]), "upvotes": (comment["comment_score"])

} for comment in comments]
- this should do the trick
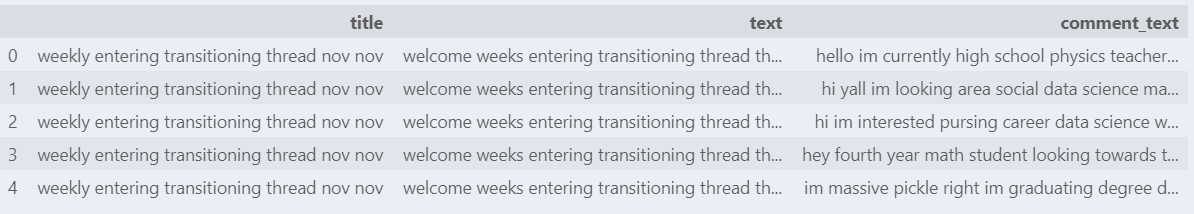
merged_df.head()
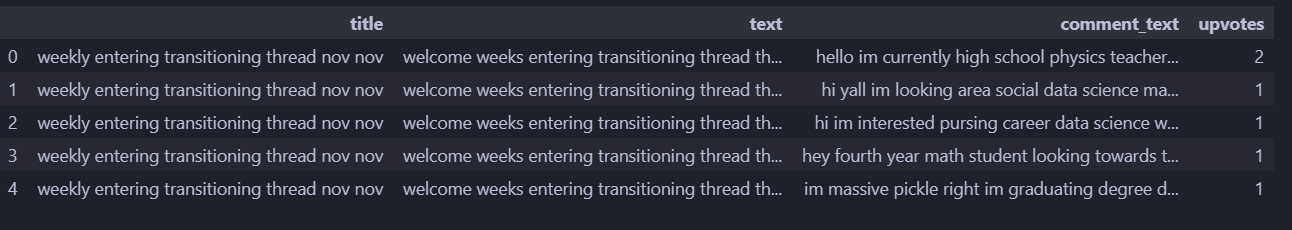
- success!
Step 4 (Data analysis)
To perform analysis on our data we need something to measure by. The upvotes are not enough since they do not correlate to positive or negative sentiment, they just act as a multiplier. Time to summon VADER.
Valence Aware Dictionary and sEntiment Reasoner
VADER (Valence Aware Dictionary and sEntiment Reasoner) is a lexicon and rule-based sentiment analysis tool that works well with sentiments expressed in social media. For example,
- understands sentiment-laden initialisms and acronyms (e.g. ‘lol’)
- understands typical negations (e.g. ‘not good’)
- understands many sentiment-laden slang words (e.g. ‘sux’)
VADER outputs a positive, neutral and negative score as well as a compound score that gives values between -1 and 1. -1 being very negative and 1 being very positive, with 0 in the middle for neutral. We will use this compound score to measure our text data more specifically the comment_text.
from nltk.sentiment import SentimentIntensityAnalyzer
nltk.download("vader_lexicon)

sia = SentimentIntensityAnalyzer()

# Add compound scores to the data frame
merged_df["sentiment"] = merged_df["comment_text"].apply(lambda x: sia.polarity_scores(x)["compound"])

merged_df.head()
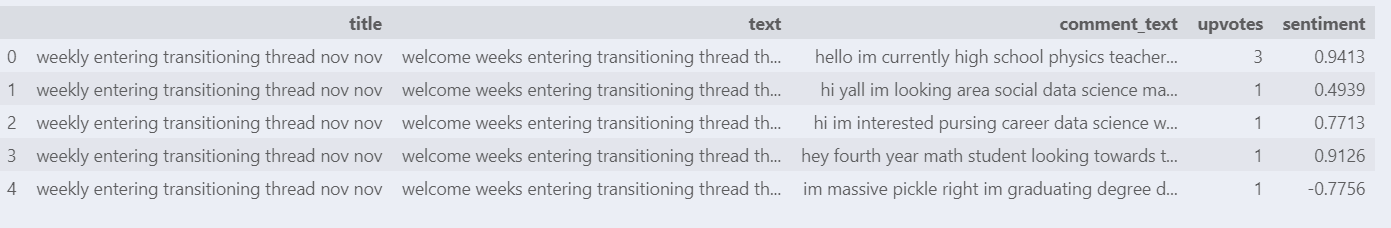
- successfully added compound scores to the data frame
Let’s look at some basic data
merged_df.describe()
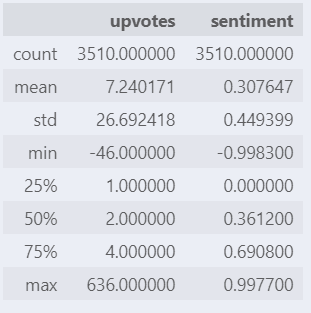
- average compound score = 0.3, around neutral
- min and max compound scores fall in the range (-1,1) and are at the extremes of the interval so scoring should be working as intended
Upvotes vs Sentiment
Let’s see the correlation between the upvotes and the sentiment score. We will use matplotlib and seaborn for their visualization capabilities.
import seaborn as sns
import matplotlib.pyplot as plt

# Scatter plot on sentiment score vs upvotes
sns.scatterplot(x = 'sentiment', y = 'upvotes', data = merged_df)
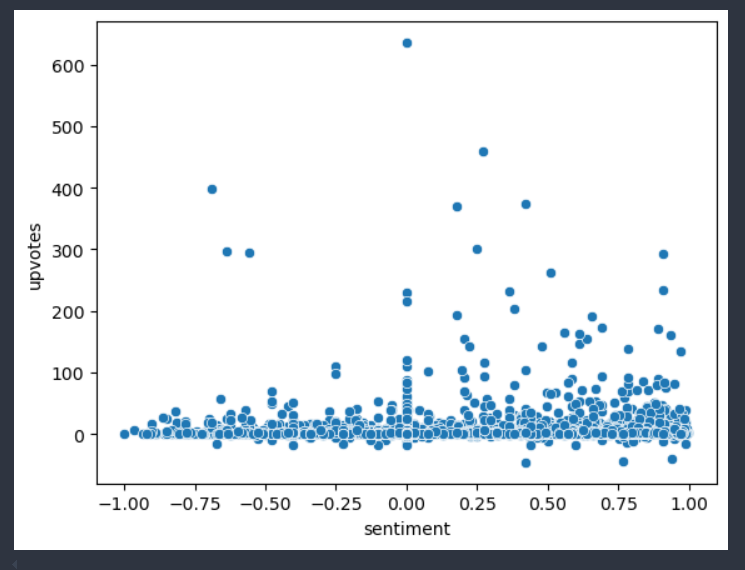
- not much correlation between sentiment and the upvotes
- most comments have a low amount of upvotes regardless of sentiment
- larger concentration of low upvotes for positive sentiment comments but that might be because there is more comments with positive sentiment than negative sentiment, let’s test this theory
# Plotting frequency of sentiment score
sns.histplot(data = merged_df, x = 'sentiment')

- theory confirmed, there are more comments with positive sentiment than negative sentiment
- by far the highest frequency of comments have neutral sentiment
The Final Merge
We are almost at the part where we can draw some final conclusions from our data. One obstacle stands in our way and that is the upvotes. Ideally we want to merge the upvotes with the sentiment score for a more accurate reflection of how the comments feel about jobs in data science.
The problem is our upvotes fall in the range of [-46,636] so we need to squeeze these scores into a range with meaning. One function that can do this is the sigmoid function,
\(σ(x) = \frac{1}{1 + e^{-x}}\)
This function will take our range of upvotes between [-46,636] and squeeze them into the range of {0,1}. A better interval would be (-1,1) so we can combine the upvotes and sentiments column by simply adding them together. In this case our negative to positive sentiment interval would change from (-1,1) —> (-2,2) with 0 still being neutral. Here is the function that will give this interval change,
\(σ(x) = \frac{2}{1 + e^{-x}}-1\)
We still have 2 problems, 1) σ(10) = 0.9999 so the difference between 10 upvotes and let’s say 100 upvotes will be negligible in our analysis. 2) Neutral comments with extreme upvotes will be skewed as positive or negative sentiment by our analysis.
We can fix the first problem by changing our sigmoid function to, \(σ(x) = \frac{100}{1 + e^{-0.01x}}-50\) This squeezes our upvotes into the interval (-50,50). The benefit of this is that it keeps 0 as the neutral point and even when we merge with sentiment the interval turns into, (-50,50) + (-1,1) —> (-51,51), with 0 still in the middle for neutral.
We can fix the second problem by not merging upvotes for sentiment scores in the range (-0.2,0.2). Upvotes for neutral statements do not really reflect on overall sentiment.
# Defining the function
def sigmoid(x):

    return 100 / (1 + np.exp(-0.01 * x)) - 50


# Applying the function to the upvotes column
merged_df['transformed_upvotes'] = merged_df['upvotes'].apply(sigmoid)
- simply defining and applying the sigmoid function to the upvotes column
# Computing the adjusted score
merged_df['final_score'] = np.where(

# Not changing score for values in (-0.2,0.2)
    (merged_df['sentiment'] <= -0.2) | (merged_df['sentiment'] >= 0.2),

    # Adding sentiment and transformed_upvotes
    merged_df['sentiment'] + merged_df['transformed_upvotes'],


    merged_df['sentiment']

)
- adding the upvotes and sentiment score for sentiment values outside of (-0.2,0.2)
Step 5 (Data visualization/analysis)
We saw that the sentiment regarding jobs in data science is generally neutral. Let’s see if our new score reflects that,
sns.histplot(data = merged_df, x = 'final_score')
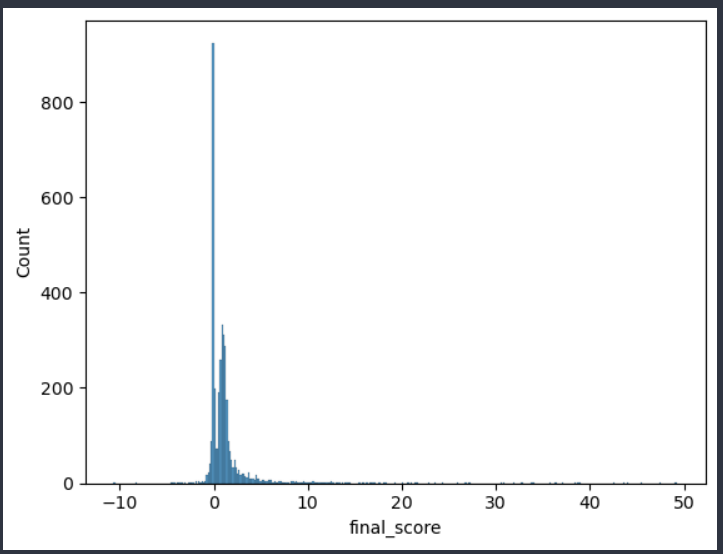
- yes most comments in the subreddit still have neutral sentiment
We can more clearly view the distribution with a kernel density estimation plot which will smooth out the above histogram,
sns.displot(merged_df, x="final_score", kind="kde")
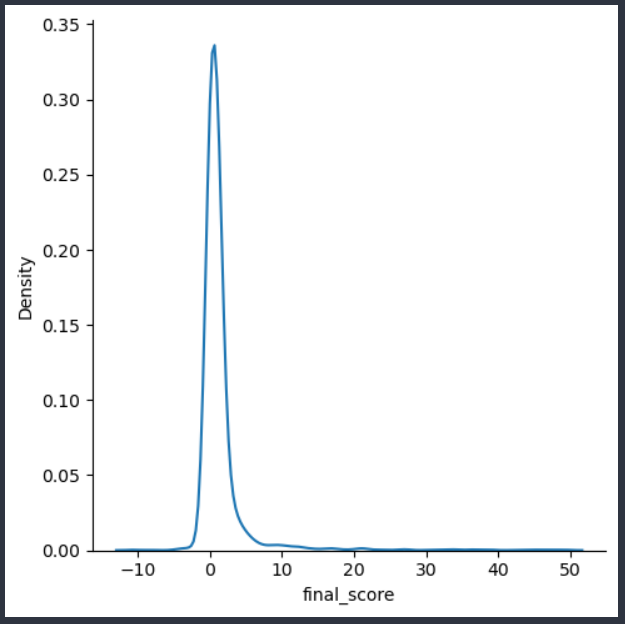
- We note the data follows an imperfect normal distribution
- ideally the normal distribution is symmetric if you take a vertical line and slice down the peak of the distribution
- however because our minimum upvotes was -46 —> σ(-46) = -11.301 and the lowest possible sentiment score was -1, our lowest possible
final_scoreis -12.3 - compare to the highest possible
final_scorevalue which is σ(636) + 1 = 50.827
Therefore the range (-50,50) for our upvotes is a tradeoff, we avoid clumping of points near the extremes but the spread of points is then skewed towards the positive direction.
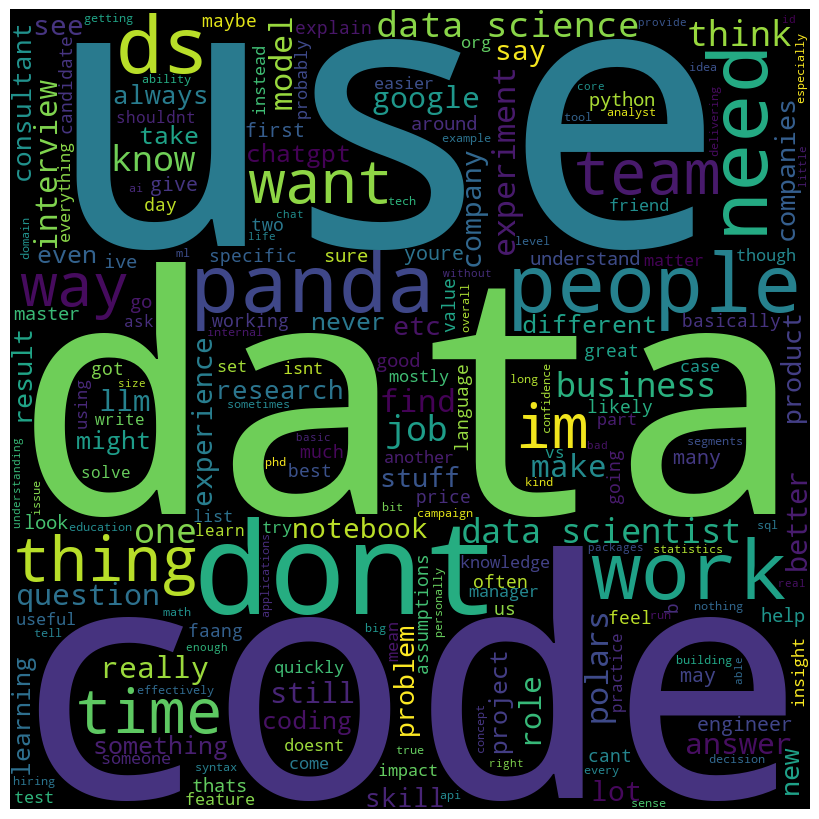
Word cloud analysis
To get more wordy let’s generate a word cloud that will show us the most common words in our data specifically in the comment_text column,
from wordcloud import WordCloud

# The data we are putting into the wordcloud
df = merged_df
comment_words = " ".join(df['comment_text'].astype(str))

# wordcloud collecting and formatting from data
wordcloud = WordCloud(
    width = 800, height = 800,
    background_color = 'black',
    min_font_size = 10,

).generate(comment_words)


# plotting the wordcloud
plt.figure(figsize = (8, 8), facecolor = None)
plt.imshow(wordcloud)
plt.axis("off")
plt.tight_layout(pad = 0)

plt.show()

- wow that’s a lot of words
- most of the words are technical but it is good to see “work” and “job” as two of the most common words since that means we at least did one thing right in our making of the dataset
Let’s extract some word clouds for positive and negative sentiment. Starting with final_score > 10,
# The data we are putting into the wordcloud
merged_df_pos = merged_df[merged_df['final_score'] > 10]
comment_words = " ".join(merged_df_pos['comment_text'].astype(str))

# wordcloud collecting and formatting from data source
wordcloud = WordCloud(
    width = 800, height = 800,
    background_color = 'black',
    min_font_size = 10,

).generate(comment_words)

# plotting the wordcloud
plt.figure(figsize = (8, 8), facecolor = None)
plt.imshow(wordcloud)
plt.axis("off")
plt.tight_layout(pad = 0)

plt.show()
- most common words for
final_score> 10 - again words are technical in nature
- “don’t” being a very common word is funny
Let’s up the positivity and retrieve data from columns with final_score > 30,
- interesting that “llm” is up here, perhaps language learning models are more positively regarded in terms of work?
- “people” is also a common word, perhaps the working people or the people in this field are well regarded?
- “time” is a common word, data scientists have a lot of free time? or they feel their time is well spent and not wasted?
- “job” another hugely common word here, general positive sentiment towards jobs in data science?
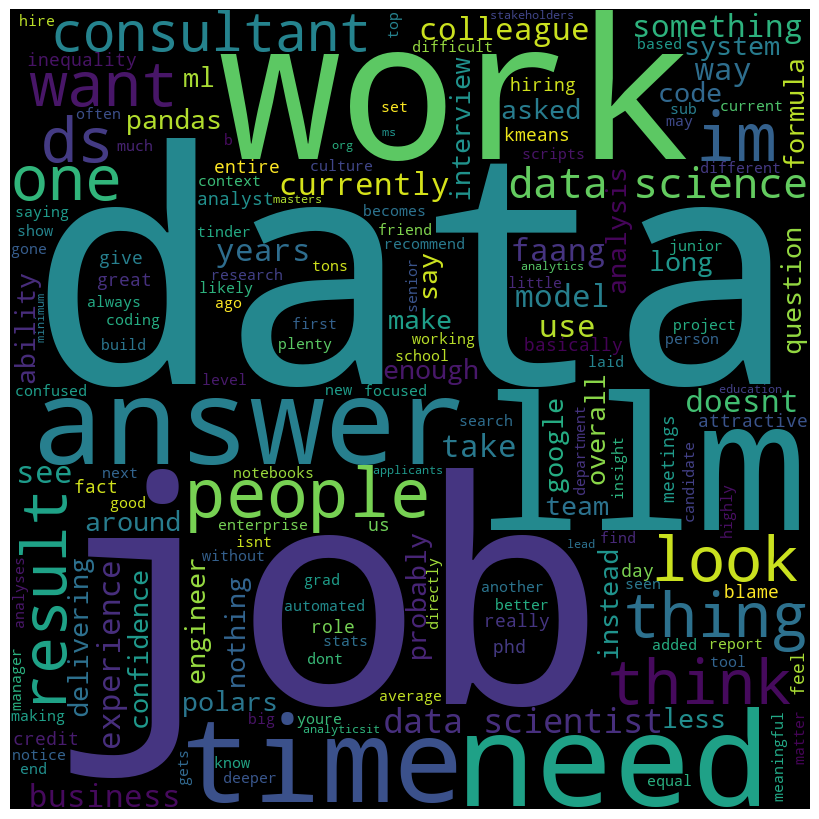
Let’s move onto final_score < -2 which will give us some insight into the negative sentiment side of our data,

- “ai” seems to be a pretty common word, negative views towards ai in the workforce/job market?
- “business” has also skyrocketed compared to when we were looking at positive sentiment word clouds, the business side of data science is not particularly admired in this subreddit?
- “product” is also showing up as a common word, more fire to the assumption that the business side of data science is not held in high regard here
Let’s get a bit more negative and set final_score < 5,

- “lol”
- “client”, “value”, “consultant”, “deliver”, “shareholder”, all business related words are cropping up even more now that our sentiment is very negative
Step 6 (Conclusions)
We note that the overall sentiment on jobs in r/datascience is neutral, however there are more positive then negative comments. The positive comments talk about the people, time, and the job itself. Therefore there seems to be a positive sentiment towards the everyday side of the data science job. On the other hand the negative comments speak of the business side of data science. It seems that the products or value that comes out of the work data scientists do is not well-liked. Additionally there seems to be negative opinions on AI and its effects on jobs and work.
There are some areas of improvement I would also like to mention. 1) The data size can be increased if we pull from more than the top 100 reddit posts or if we filter first and then take the top 100 posts. 2) The filtering can also be tweaked to allow for more data or less but more related data, the filter choice as seen in the “job” problem was arbitrary and assumes that every post with the chosen words will have comments related to those words. 3) The function used to merge the upvotes and sentiment score can be tweaked and improved to allow for a better data spread
In part 2 we will see how our analysis here compares to other jobs in different subreddits and build some models with our data to predict the sentiment in other fields.
tags: